
Hola mis amigos: A VUELO DE UN QUINDE EL BLOG., la Agencia Espacial NASA, está monitoreando el movimiento de la Corriente del Niño, más conocida en el Perú como "Fenómeno del Niño", NASA, con la ayuda del satélite NASA’s Earth Observatory, ha observado que efectivamente esta corriente ya está en franco crecimiento.
NASA, nos dice: "Cuando los científicos declararon marzo 2015 que las condiciones de El Niño se habían desarrollado en el Océano Pacífico, el consenso fue que el evento era demasiado débil y demasiado tarde para tener mucho efecto en América del Norte. Pero en los últimos meses, el agua caliente se ha chapoteando en el Pacífico occidental hacia las Américas y El Niño se ha fortalecido. Las aguas superficiales han crecido significativamente más cálidas en el Pacífico central y oriental, y las condiciones se han convertido en algo más fresco y más seco en el oeste. A finales de julio de 2015, los científicos de la NASA y otras agencias comenzaron a ver algunas similitudes entre las condiciones actuales y el desarrollo de la potente fenómeno de El Niño de 1997-98....."
NASA, agrega: "No hemos visto una señal de este tipo en el Pacífico tropical desde 1997", dijo Bill Patzert, climatólogo del Laboratorio de Propulsión a Chorro de la NASA. "No es ninguna apuesta segura de que vamos a tener un fuerte El Niño, pero la señal es cada vez más fuerte. ¿Qué ocurre en agosto y octubre debe hacer o romper este evento ".Los mapas en esta página ofrecen vistas de la NASA de las condiciones del océano Pacífico. En la parte superior de la página, se puede ver instantáneas de las anomalías de la altura de la superficie del mar promediadas en cuatro momentos diferentes desde marzo de 2015. Las sombras de rojo indicará donde el océano se situó por encima del nivel normal del mar porque el agua más caliente se expande para llenar más volumen (expansión térmica) . Tonos de azul espectáculo donde el nivel del mar y las temperaturas inferiores a la media (contracción térmica). Las condiciones normales del nivel del mar aparecen en blanco. Los mapas se basan en mediciones de altimetría hechas por el OSTM / Jason-2 satélite y analizadas por los científicos del Laboratorio de Propulsión a Chorro de la NASA.A continuación puedes ver una animación de los mismos datos a partir del 1 de enero hasta el 31 de julio de 2015. Nota cómo pulsos de agua más caliente parecen moverse de oeste a este a través de la cuenca del Pacífico. Hay una sutil señal en enero, y luego cada vez más fuertes impulsos en marzo, mayo y julio....."
More information....
El Niño conditions are growing stronger
When scientists declared in March 2015 that El Niño conditions had developed in the Pacific Ocean, the consensus was that the event was too weak and too late to have much effect on North America. But in the past several months, warm water has been sloshing from the western Pacific toward the Americas and El Niño has strengthened. Surface waters have grown significantly warmer in the central and eastern Pacific, and conditions have become somewhat cooler and drier in the west. By the end of July 2015, scientists at NASA and other agencies started to see some similarities between current conditions and the development of the potent El Niño event of 1997–98.
“We have not seen a signal like this in the tropical Pacific since 1997,” said Bill Patzert, a climatologist at NASA’s Jet Propulsion Laboratory. “It’s no sure bet that we will have a strong El Niño, but the signal is getting stronger. What happens in August through October should make or break this event.”
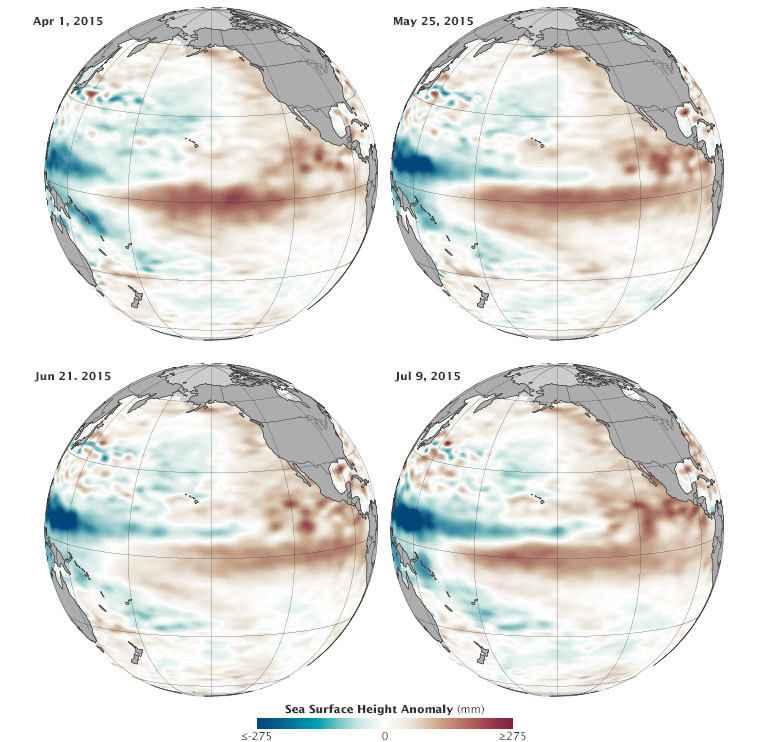
The maps on this page provide NASA’s view of Pacific Ocean conditions. At the top of the page, you can see snapshots of the averaged sea surface height anomalies at four different moments since March 2015. Shades of red indicate where the ocean stood above normal sea level because warmer water expands to fill more volume (thermal expansion). Shades of blue show where sea level and temperatures were lower than average (thermal contraction). Normal sea-level conditions appear in white. The maps are based on altimetry measurements made by the OSTM/Jason-2 satellite and analyzed by scientists at NASA’s Jet Propulsion Laboratory.
Below you can see an animation of the same data from January 1 through July 31, 2015. Note how pulses of warmer water seem to move from west to east across the Pacific basin. There is a subtle signal in January, and then increasingly stronger pulses in March, May, and July.
The pulses of warmer water moving across the ocean are Kelvin waves. Sea level is naturally higher in the western Pacific; in fact, it is roughly 40 to 50 centimeters (15-20 inches) higher near Indonesia than off of Ecuador. Much of this difference is due to tropical trade winds, which predominantly blow from east to west across the Pacific Ocean, piling up the water near Asia and Oceania. When those trade winds ease and bursts of wind come out of the west, warm water from the western Pacific sloshes east in vast and deep waves and evens out sea level a bit. As the warm water piles up in the east, it suppresses the natural upwelling that usually keeps waters cooler along the Pacific coasts of the Americas.
The seas and skies have been doing just that in 2015. According to observations compiled by the National Oceanic and Atmospheric Administration (NOAA), at least three sizable west wind bursts have occurred in the Pacific since March, and each came shortly before a Kelvin wave rolled across the basin. Those waves have raised water temperatures in the central and eastern Pacific by as much as 1.6 degrees Celsius (2.9° Fahrenheit) above normal, making for a “strong” El Niño. The warmers waters off the west coast of the Americas have led to warmer and more humid weather ashore, as well as soaking bursts of rain. At the same time, Indonesia and other parts of the western Pacific have been unusually dry.
“Sea surface temperatures in the eastern Pacific have been waxing and waning,” Patzert said. “Right now they are waxing.” But will sea surface conditions and winds amplify the warming signal and produce an El Niño to rival 1997–98?
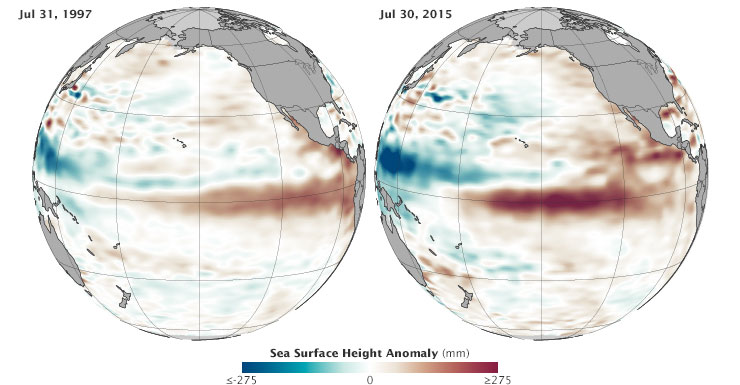
Below you will find a comparison of sea surface height in the Pacific as measured at the end of July in 1997 and 2015. The left-side measurements come from the TOPEX/Poseidon mission, while the right side is from Jason 2. Comparing the two years, 1997 seems slightly less intense. But trade winds collapsed and the eastern Pacific warmed dramatically from August through November 1997, setting the stage for a turbulent winter that brought flooding rains and landslides across the West Coast of North and South America. (Click here to see an animation of 1997 conditions compared to 2015.)
“This El Niño is getting billed as the ‘great wet hope.’ Many people in the American West are looking to El Niño to save them from drought,” Patzert noted. But he cautioned that “1997 was mayhem,” and drenching rains on a parched landscape are just as hazardous as a drought.
El Niño typically peaks between December and April, so only time will tell if this event will be potent. Many of the models and observations suggest it will be, but other factors such as the “warm blob” in the North Pacific and the apparent shift in the Pacific Decadal Oscillation could affect further development.
“With hopes for drought relief running so high in California, it can’t be stressed enough that El Niño shifts the odds but doesn’t guarantee the roll of the meteorological dice in any particular winter,” wrote meteorologist and blogger Bob Henson.
Scientists from NASA’s Goddard Space Flight Center and other institutions recently found that California has accumulated a “rain debt” of about 50 centimeters (20 inches) between 2012 and 2015. That is the amount that would normally fall in an entire year in the state.
And even if the rains come, they do not necessarily solve drought problems in areas that rely on snow pack for summer supplies. “It took a long time to get into this drought,” Patzert added, “and it is more of a systemic problem than just a lack of rain or snowfall.”
References and related reading
- NASA JPL Ocean Surface Topography from Space (2015) El Niño 2015. Accessed August 3, 2015.
- NOAA Climate.gov (2015, July 7) Keep calm and stop obsessing over weekly changes in ENSO. Accessed August 3, 2015.
- NOAA Climate.gov (2015, July 9) July 2015 El Niño Update: Bruce Lee? Accessed August 3, 2015.
- NASA Earth Observatory (2015, April 18) Warm Water and Strange Weather May Be Connected.
- NASA Earth Observatory (2015, March 25) Weak El Niño, but Hints of Pacific Change.
- NASA Earth Observatory (2009) World of Change: El Niño, La Niña, and Rainfall.
- NASA Precipitation Measurement Missions (2015) NASA Calculates California’s Rain Debt. Accessed August 3, 2015.
- Los Angeles Times (2015, July 29) El Niño contributing to ‘monsoon on steroids’ behind Southland’s humid weather. Accessed August 3, 2015.
- Mother Jones (2015, July 30) El Niño vs. the Blob: Here’s Why California’s Drought Probably Won't End Anytime Soon. Accessed August 3, 2015.
- WunderBlog, via Weather Underground (2015, July 28) What to Expect from El Niño: North America. Accessed August 3, 2015.
NASA
Guillermo Gonzalo Sánchez Achutegui
ayabaca@gmail.com
ayabaca@hotmail.com
ayabaca@yahoo.com
Inscríbete en el Foro del blog y participa : A Vuelo De Un Quinde - El Foro!
No hay comentarios:
Publicar un comentario